Good observability starts before the outage.
One of the recurring themes across Auzietek projects is that applications should be designed for operations from the beginning. Logging, metrics, tracing, health reporting, messaging, and dashboards should not be afterthoughts added after deployment. They should be woven into the application itself.
RX-Demo is a reference implementation for that idea. It demonstrates these concepts using ASP.NET, RabbitMQ, SQL Server, Redis, OpenTelemetry, Grafana, Loki, Tempo, Prometheus, Docker Compose, and Kubernetes.
This project is intentionally larger than a simple CRUD sample. It models a prescription workflow using event-driven microservices while exposing nearly every layer of the application through structured telemetry.
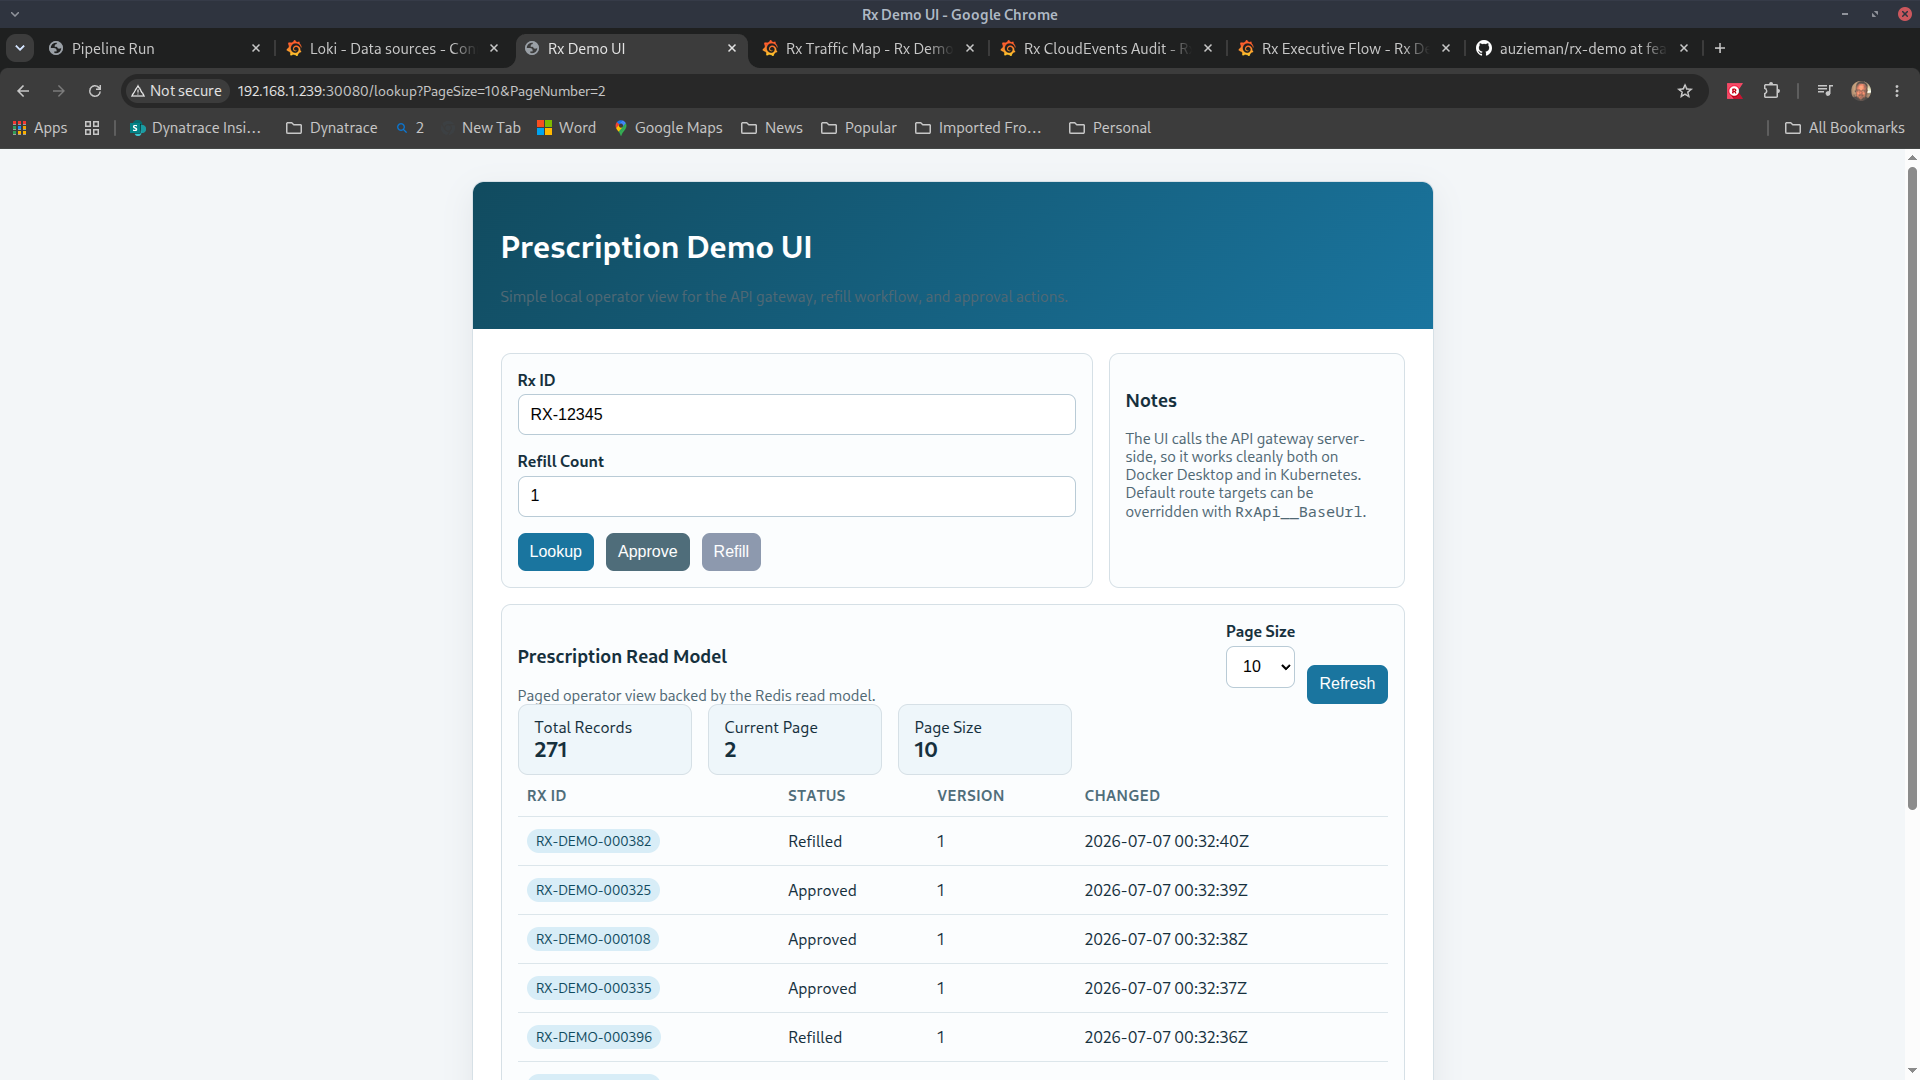
The point is not to bolt monitoring onto a finished system as decoration. The point is to build a service that can explain itself while it runs.
Architecture overview
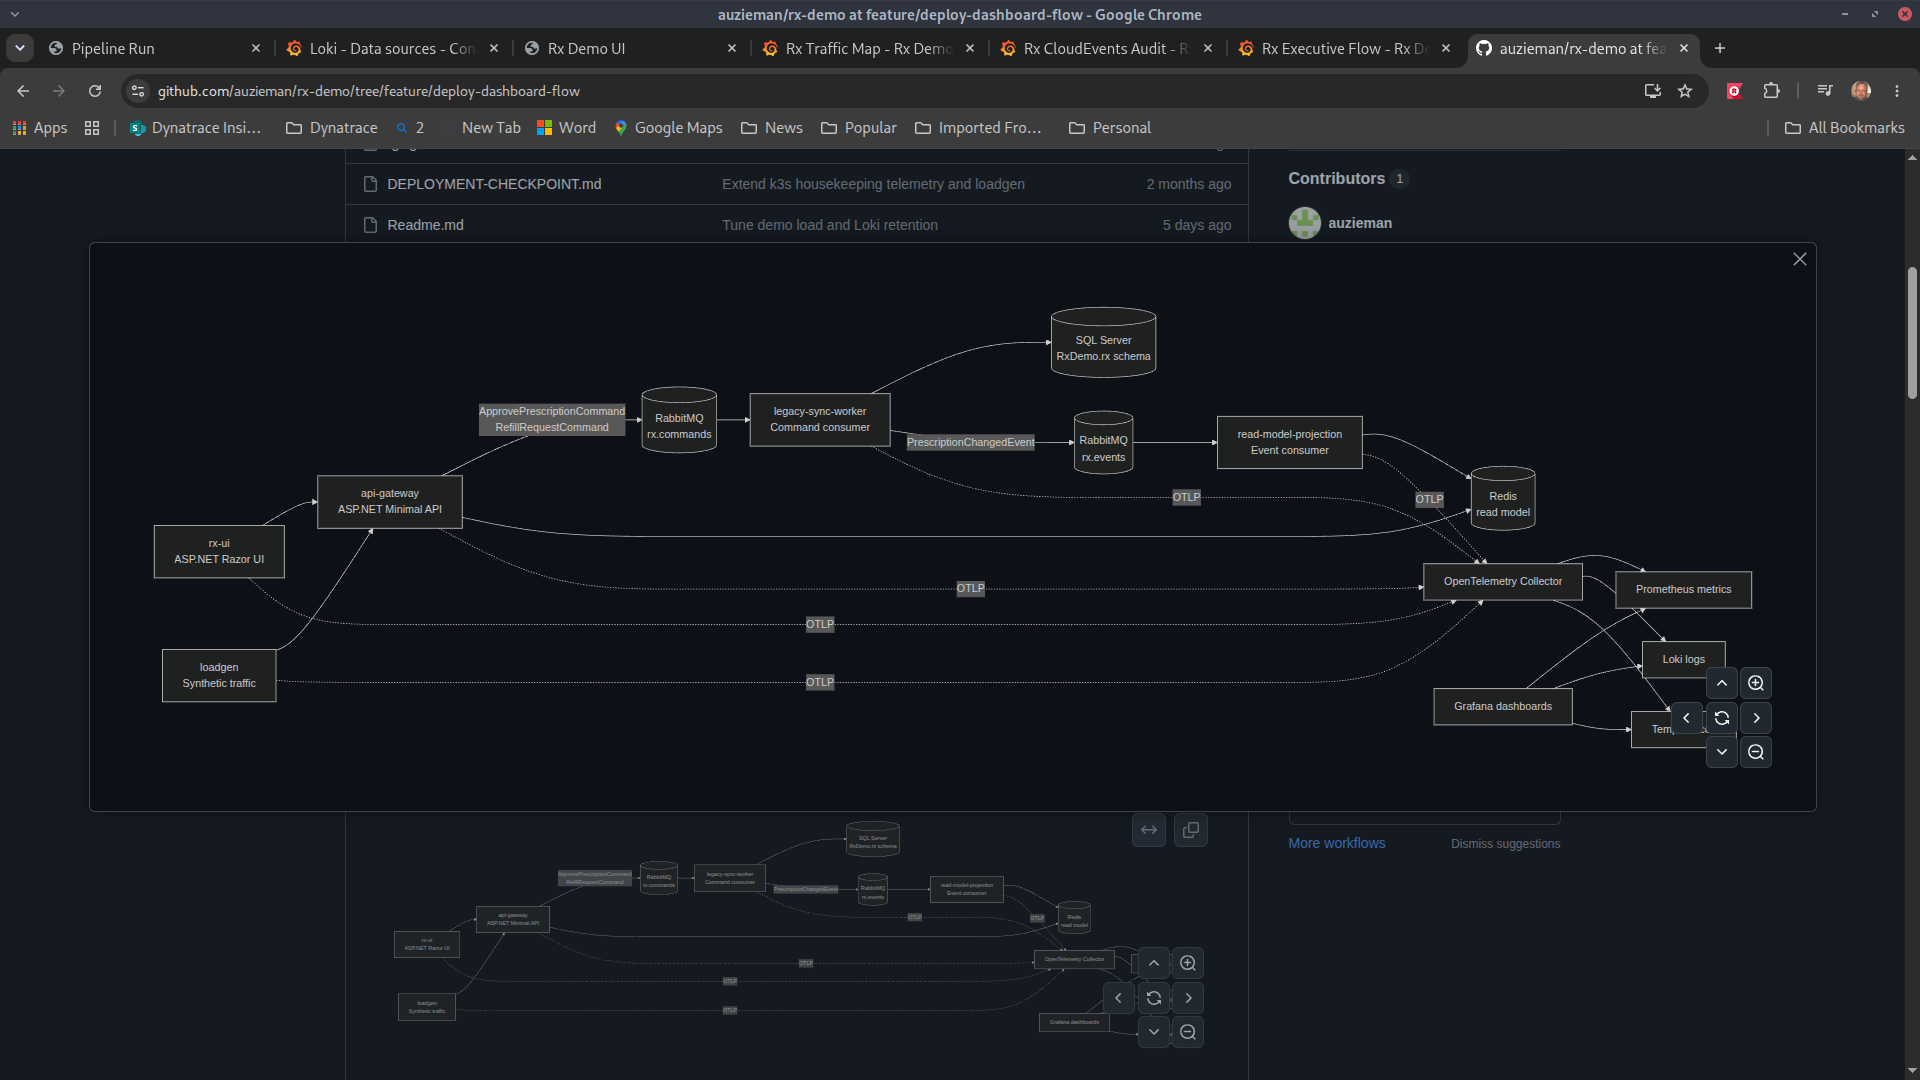
RX-Demo demonstrates a complete event-driven workflow rather than a traditional monolithic application:
- ASP.NET API Gateway
- RabbitMQ command and event bus
- background worker services
- SQL Server persistence
- Redis projection cache
- OpenTelemetry Collector
- Prometheus metrics
- Loki structured logging
- Tempo distributed tracing
- Grafana dashboards
Each component generates telemetry as work flows through the system, allowing developers to follow a single prescription request from the browser through API calls, queued messages, database updates, event publication, cache projection, and response.
Structured JSON logging
Traditional application logging often produces long text files that require manual searching. RX-Demo instead emits structured JSON logs where each field can be indexed, filtered, queried, and correlated.
{
  "PrescriptionId": 12345,
  "Patient": "*****",
  "Status": "Approved",
  "ElapsedMs": 34,
  "CorrelationId": "..."
}
Structured logging allows Grafana, Loki, and Elastic-style platforms to search large volumes of events quickly while preserving important business and operational context.
Metrics designed for operations
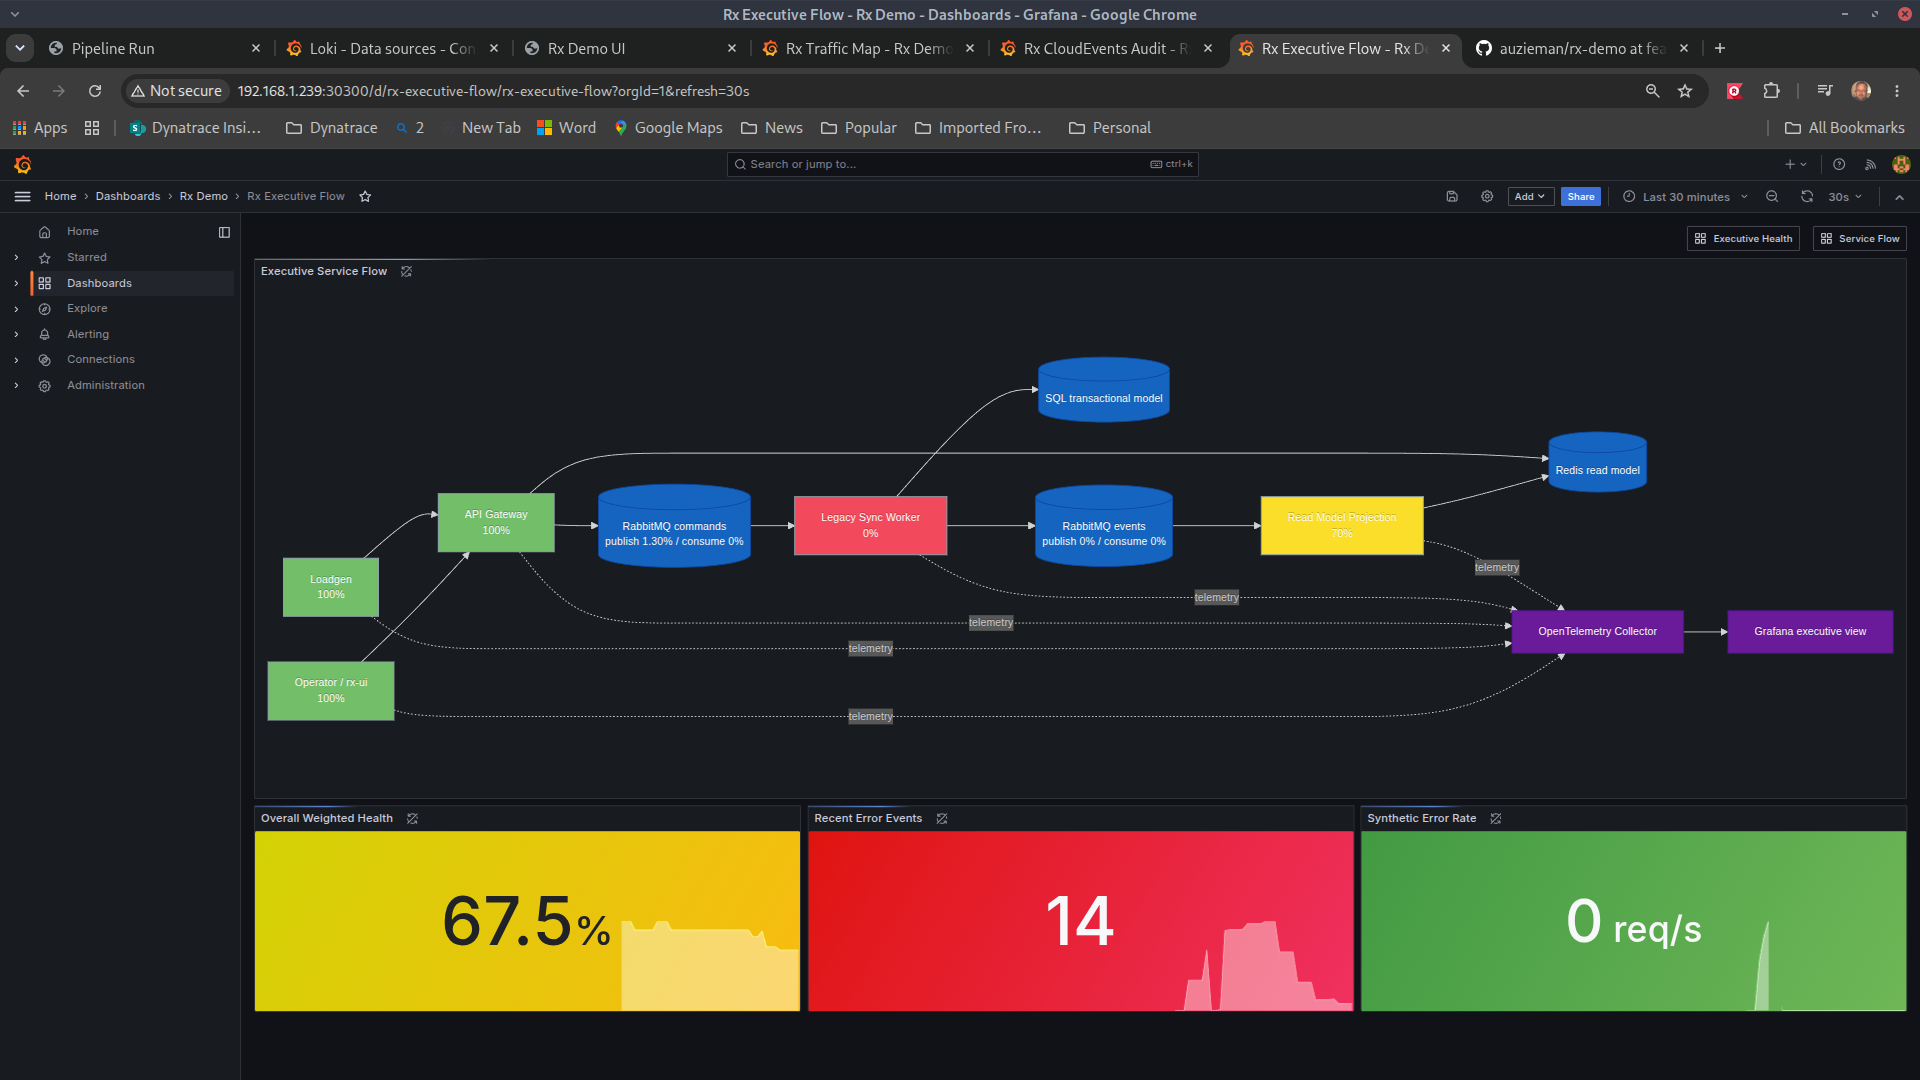
Every service exports Prometheus metrics including request counts, processing latency, queue depth, worker activity, and application health. These metrics become the foundation for dashboards, alerting, and deployment validation.
Rather than asking, “Is the server running?”, operators can ask:
- Which service is slowing down?
- How many prescriptions are queued?
- What percentage of approvals are failing?
- How long does an average refill take?
- Are the dashboards and telemetry endpoints actually usable?
Distributed tracing
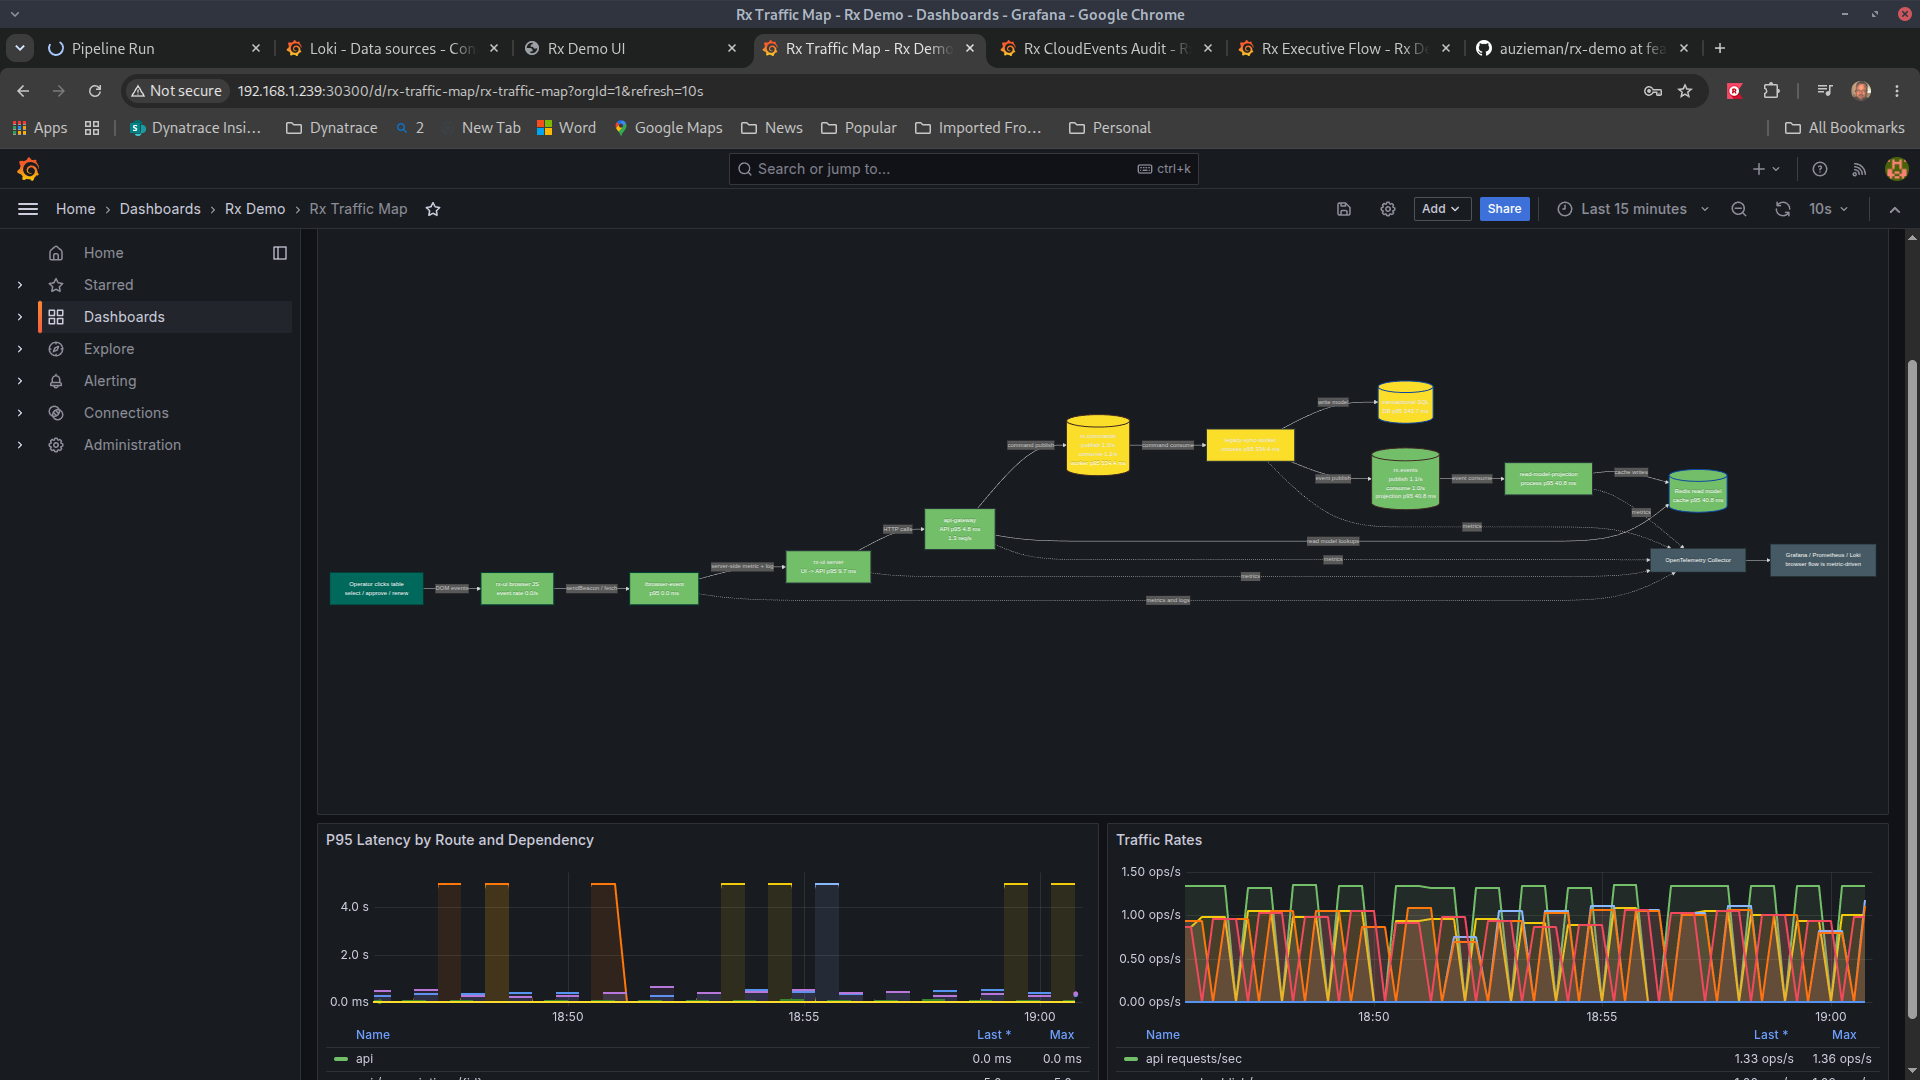
Metrics show rates and counts. Logs show events. Traces show the path.
In RX-Demo, a single request can cross the API, the queue, a worker, the database, Redis, and projection logic. Distributed tracing gives that chain a shape so an operator can see where time is spent and where a failure appeared.
Containers make the lesson portable
Docker Compose and Docker Swarm are useful teaching targets because they expose the core ideas without requiring a full Kubernetes conversation first:
docker compose up -d
docker compose logs -f
docker stack services demo
docker service ps demo_web
Those commands are approachable. They also map cleanly to larger systems later.
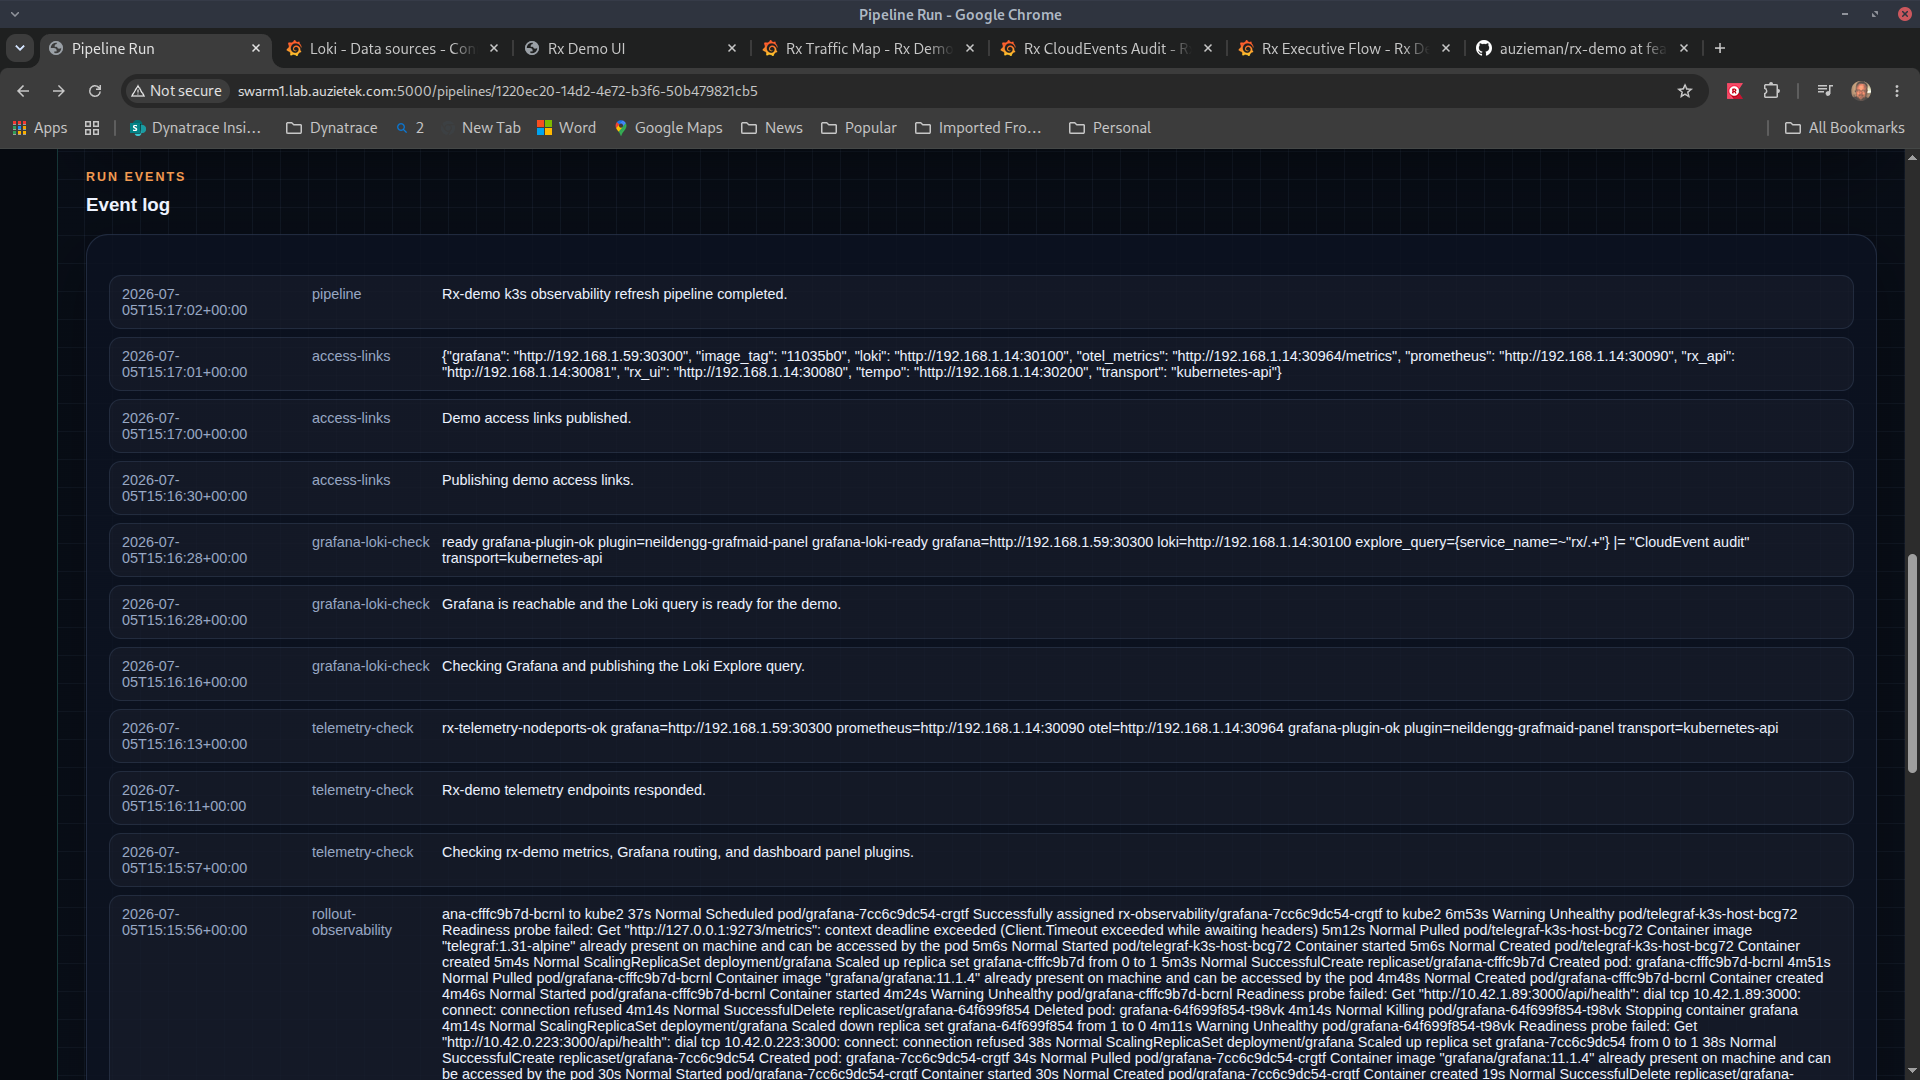
The legacy article also preserved pipeline-style validation output:
✓ Updating source from Git

✓ Applying Kubernetes manifests

✓ Waiting for Grafana, Prometheus,
  Loki, and Tempo

✓ Telemetry endpoints responded

✓ Grafana plugin validation passed

✓ Loki query prepared

✓ Demo access links published

✓ Pipeline completed
That output is important. It shows that observability was not only a dashboard theme; it was part of the deployment contract.
Why it belongs in the Linux lane
RX-Demo is not just an application story. It is a Linux operations story: processes, ports, container images, environment variables, logs, health checks, storage, and dashboards all meet in one place.
That makes it a good bridge between “I can run Linux commands” and “I can operate a service.”
Legacy source: Auzietek RX-Demo article.